🛸 UFO Data Explorer
A data science project exploring the geography of UFO sightings - and the gaps, biases, and unanswered questions hidden inside incomplete datasets.
🧠 Concept
This project began with a deliberately provocative question:
Where in the world are UFO sightings not being reported - and what might those gaps mean?
Rather than hunting for patterns in the sightings themselves, I focused on the voids: the regions with few or no reports, the inconsistencies in global data collection, and the limitations of drawing bold conclusions from imperfect information. The notebook is both a technical exercise and a reflection on how data science can mislead when the dataset is patchy, biased, or incomplete.
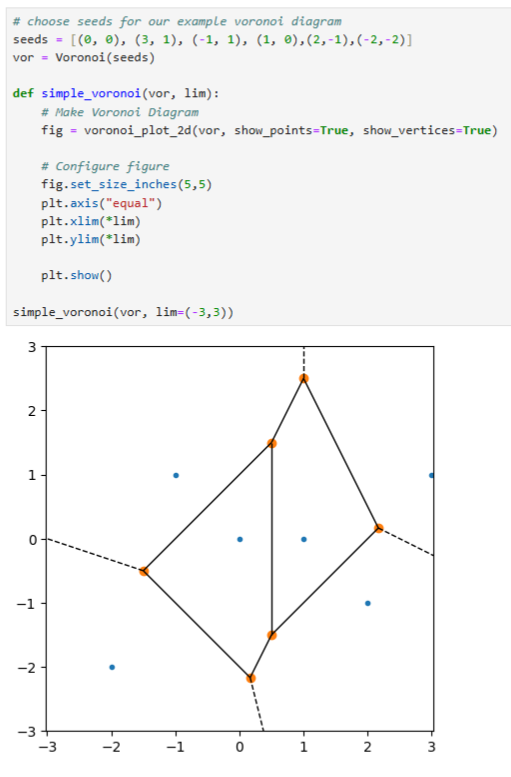
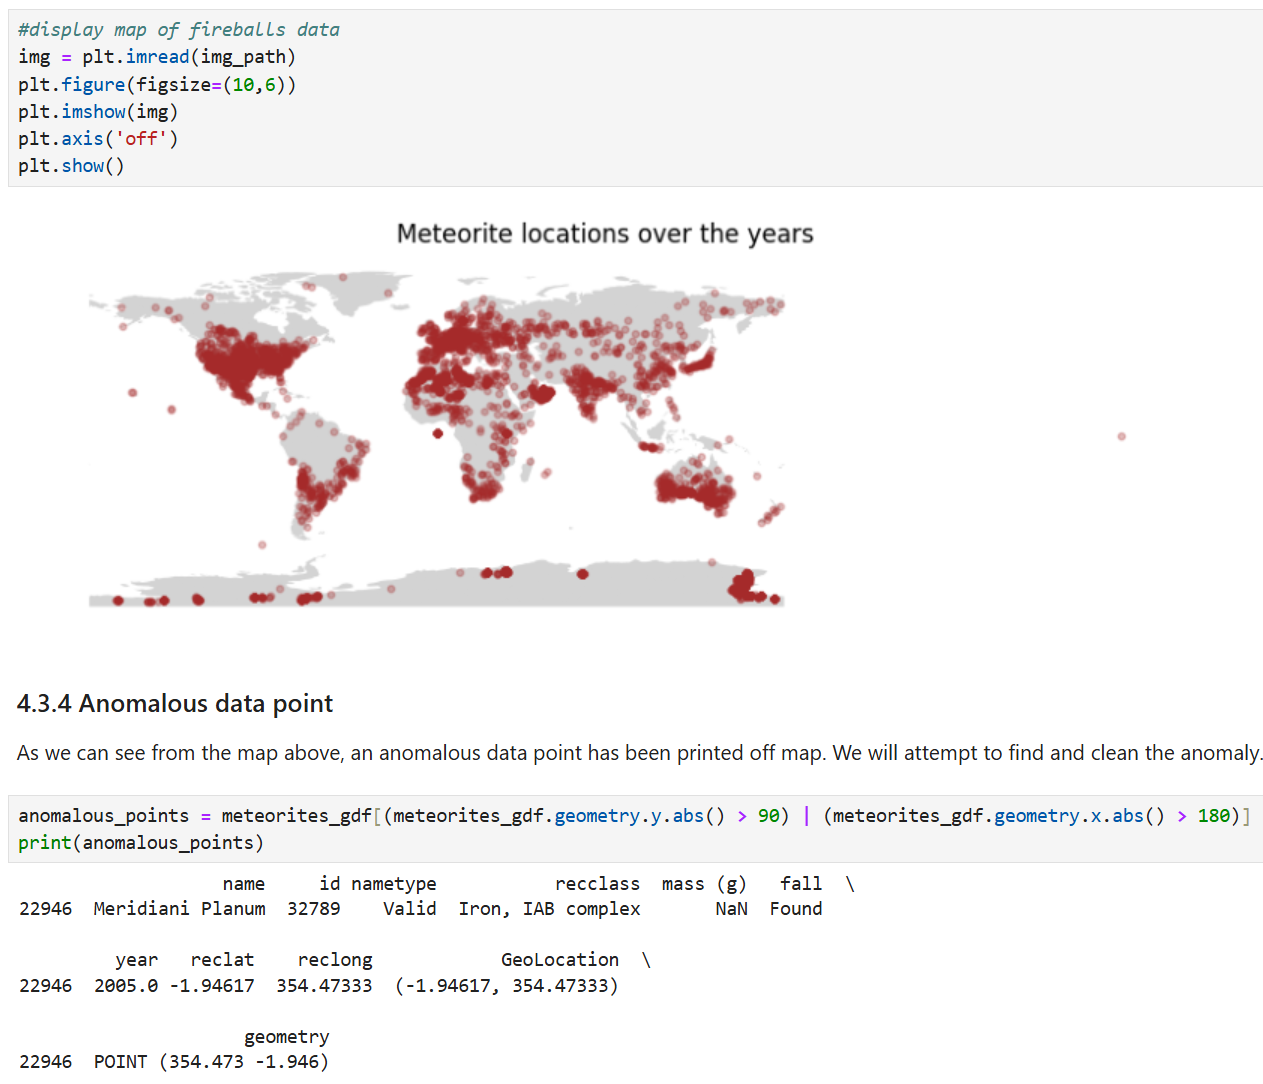
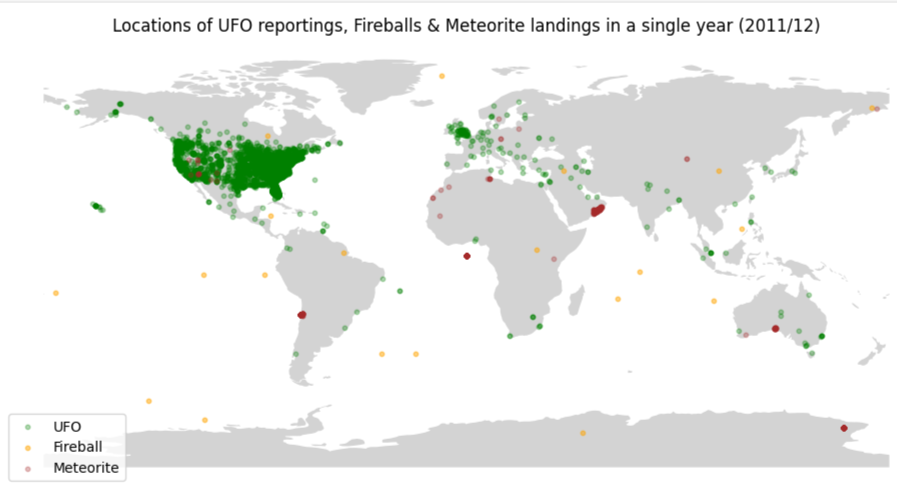
My original plan was to generate an ‘inverse map’ using Voronoi diagrams to highlight the areas furthest from any reported sighting. After outlining the method, I found the global-scale computation impractical - so I pivoted. I brought in two NASA datasets (fireballs and meteorite landings) to compare known atmospheric events with reported UFO locations, exploring how multiple layers of sky-activity data might inform future research.
🧩 My Role
- Designed and executed the full data exploration workflow
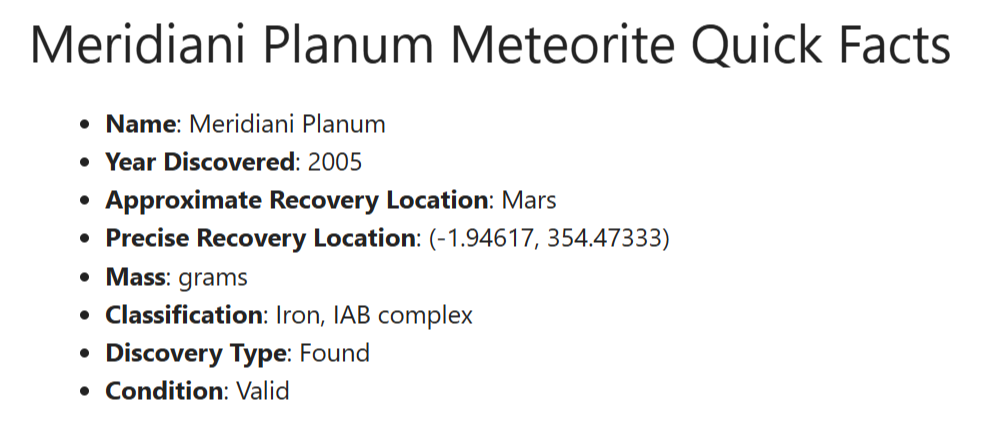
- Cleaned and analysed multiple geospatial datasets
- Experimented with Voronoi-based mapping concepts
- Built maps and visualisations using Python geospatial libraries
- Reflected on data gaps, bias, and the limits of interpretation
🛠️ Tech Stack
Python • Jupyter notebooks • pandas • geopandas • matplotlib & seaborn • folium • scipy
🔧 Process
Goal
To explore UFO sightings through the lens of absence, not presence - and to experiment with geospatial methods for mapping the ‘quiet zones’ of reported activity.
Constraints
- Voronoi-based inverse mapping was computationally heavy for global-scale data
- UFO dataset contained inconsistencies, missing values, and uneven global coverage
- NASA datasets varied in resolution and format
- Time constraints for implementing a full geospatial pipeline
Approach
- Cleaned and standardised the UFO dataset
- Mapped sightings year-by-year to reveal clustering
- Outlined a method for generating inverse Voronoi regions
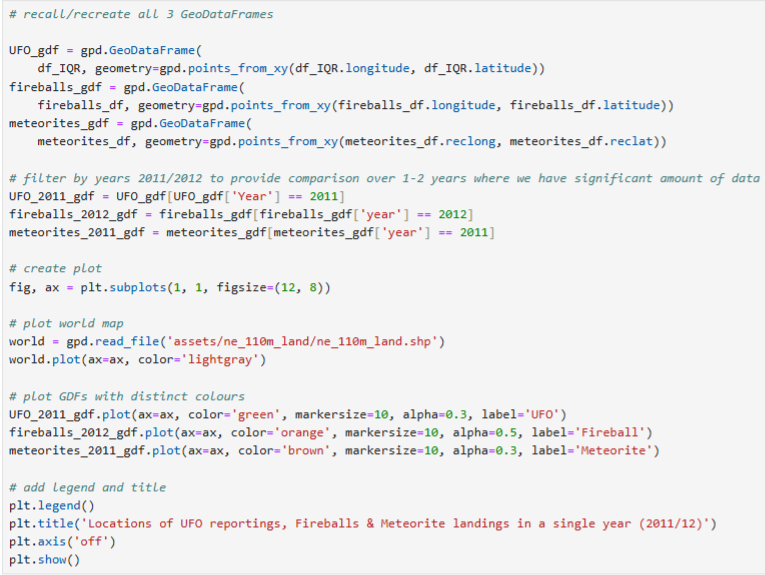
- Pivoted to comparing UFO data with NASA meteor and fireball datasets
- Explored overlaps, mismatches, and what they imply about reporting bias
- Reflected on the philosophical side of ‘unknown’ vs ‘unidentified’
Key Decisions
- Documented the Voronoi method rather than forcing an incomplete implementation
- Expanded the project to include NASA datasets for richer comparison
- Chose visual clarity over algorithmic complexity for the final maps
- Emphasised the limitation of the data as part of the project’s value
🎥 Media
⭐ Reflections
What worked
- Honest documentation of both successful and abandoned approaches
- Clear visualisations that highlight clustering and absence
- A playful but thoughtful narrative about uncertainty and bias
What I’d improve
- Implement a more efficient Voronoi pipeline using spatial indexing
- Bring in higher-resolution global datasets
- Explore clustering or anomaly-detection methods for cross-dataset comparison
What I learned
- How to handle messy real-world geospatial data
- The limits of certain algorithms at global scale
- The importance of interrogating what’s missing, not just what’s present
- That exploratory analysis can be meaningful even without a definitive conclusion